
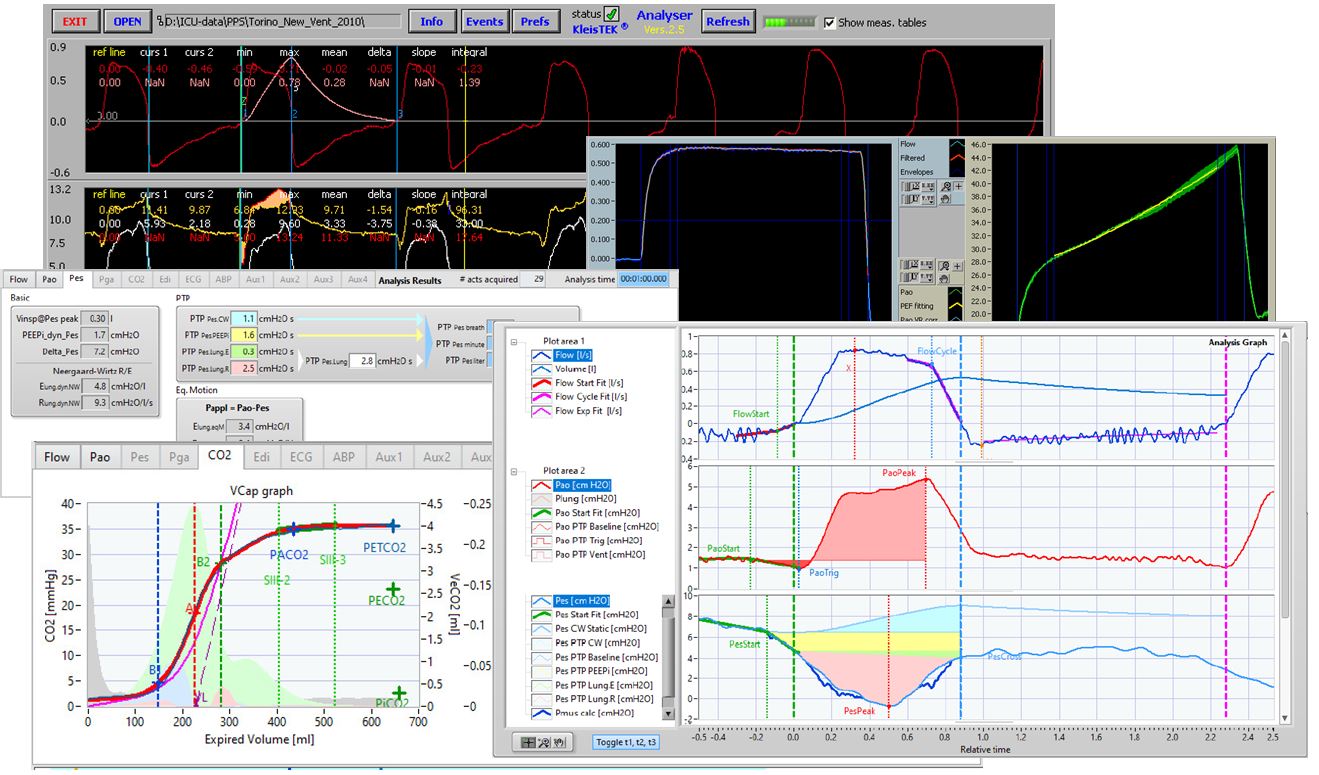
Respiratory mechanics: basic measurements with ICU-Lab
In a mechanically ventilated patient, every breath is a small laboratory test. By continuously measuring airway pressure and flow, it is possible to derive the parameters that describe how the respiratory system behaves: how “stiff” it is, how much resistance it offers to airflow, how it responds to ventilator settings. This is respiratory mechanics, and the ICU-Lab software was created to acquire and analyse these signals for research and teaching.
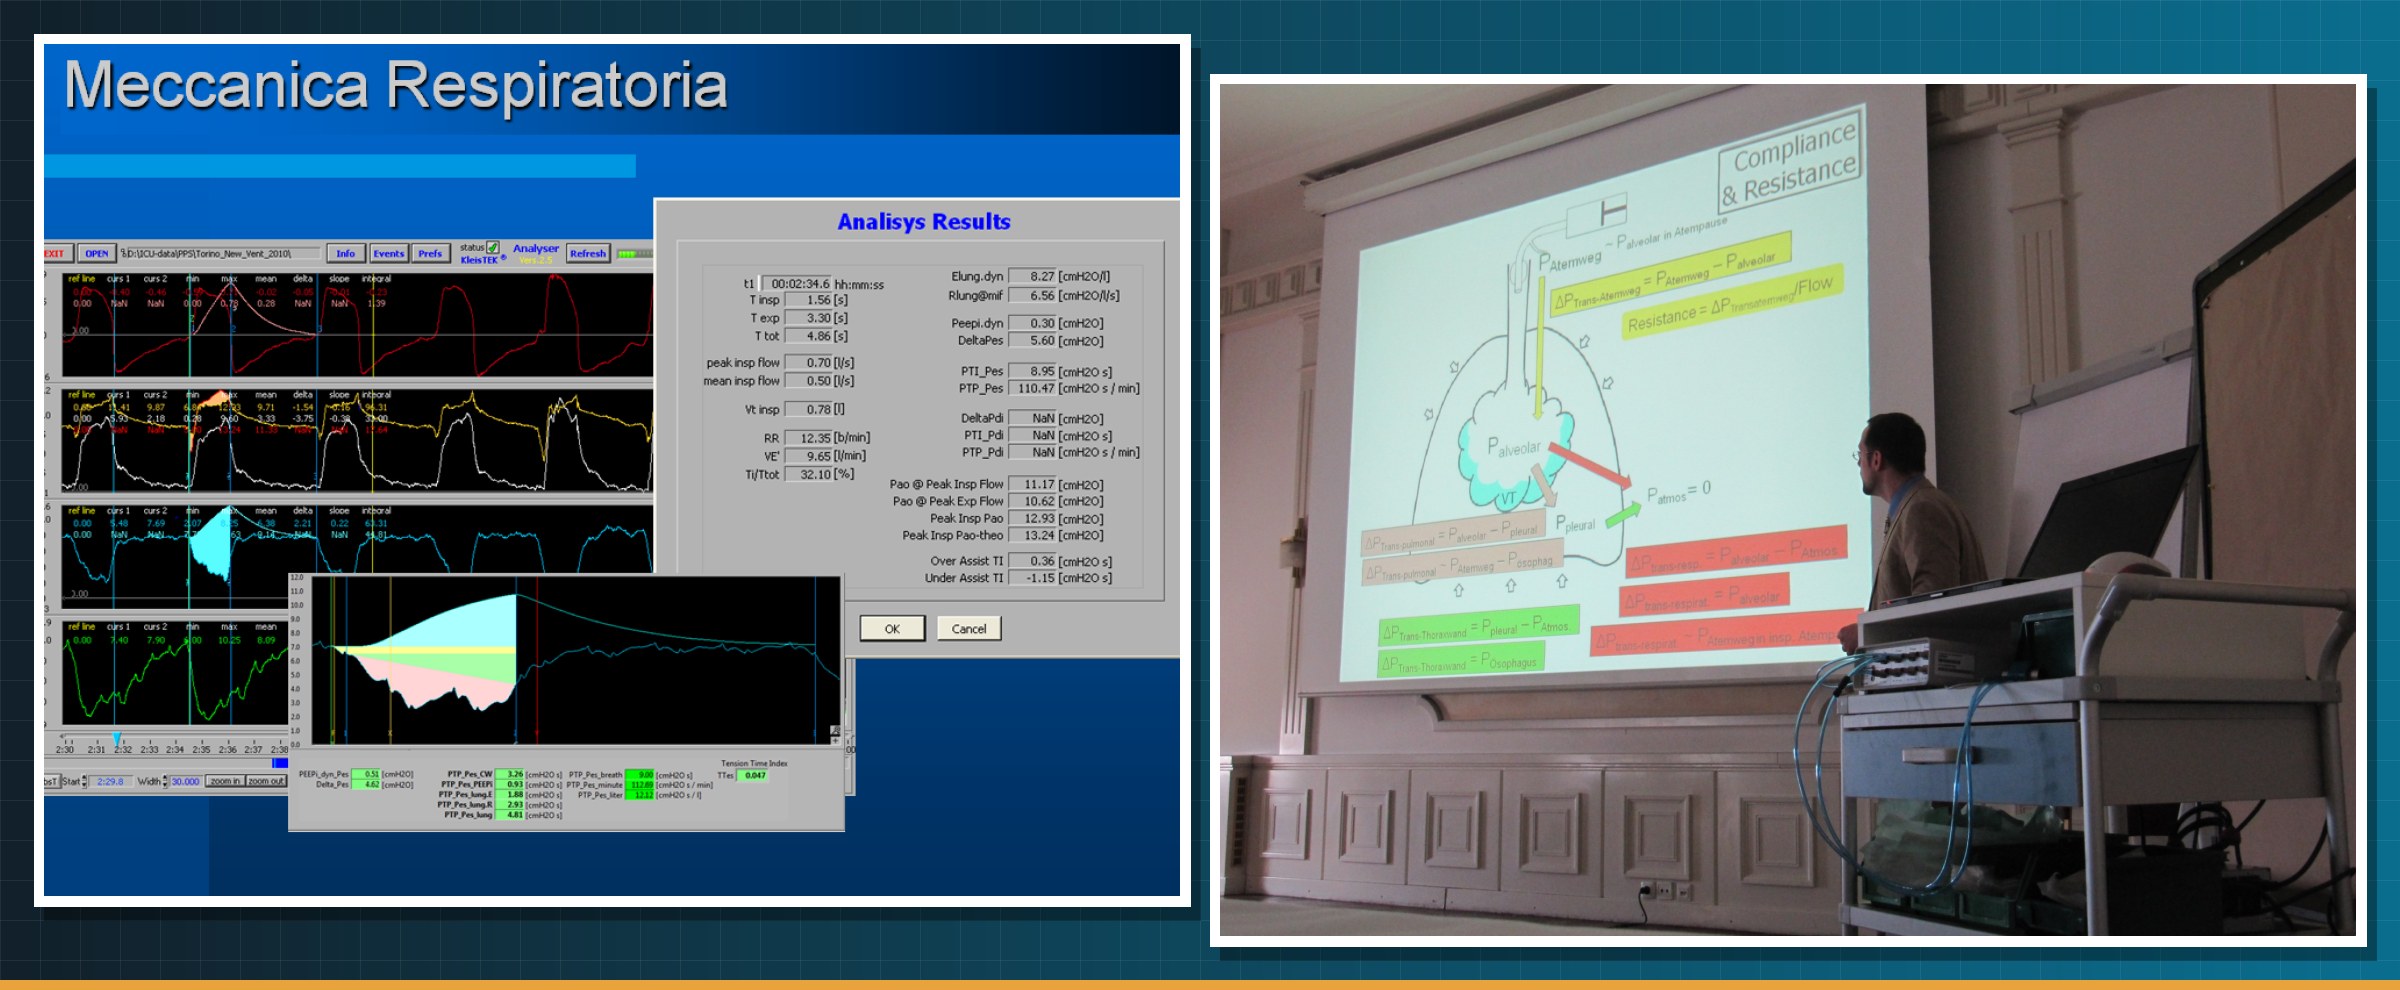
The starting signals
- Airway pressure (Paw), measured at the airway opening, in cmH₂O.
- Flow (V̇), in L/s or L/min: positive during inspiration, negative during expiration.
- Volume (V), obtained by integrating flow over time; the volume inspired in one breath is the tidal volume (Vt).
The model: the equation of motion
In its simplest form the respiratory system is described as an elastic balloon connected to a tube. Part of the applied pressure inflates the balloon (elastic component) and part overcomes air friction in the tube (resistive component):
Paw = V / C + R · V̇ + PEEPtot
where C is compliance (how much volume enters for each cmH₂O of pressure), R is airway resistance and PEEPtot is the pressure present at the end of expiration. Knowing Paw, V̇ and V at each instant, the parameters can be estimated breath by breath.
Occlusion manoeuvres
The most direct method is the end-inspiratory pause: at the end of inspiration, flow is stopped for a moment. With zero flow the resistive component disappears and pressure falls from its peak value (Ppeak) to a plateau value (Pplat), which reflects the elastic component only. From this:
R = (Ppeak − Pplat) / V̇ Cst = Vt / (Pplat − PEEPtot)
Similarly, an end-expiratory pause reveals any intrinsic PEEP: if expiration does not have time to complete, a pressure higher than the PEEP set on the ventilator remains in the lungs.
A worked example. With Vt = 500 mL, a constant inspiratory flow of 1 L/s, Ppeak = 24, Pplat = 18 and PEEP = 5 cmH₂O we get R = (24 − 18) / 1 = 6 cmH₂O·s/L and Cst = 500 / (18 − 5) ≈ 38 mL/cmH₂O. The difference Pplat − PEEP, here 13 cmH₂O, is the driving pressure, one of the most studied parameters in protective ventilation.
Beyond average values: the stress index
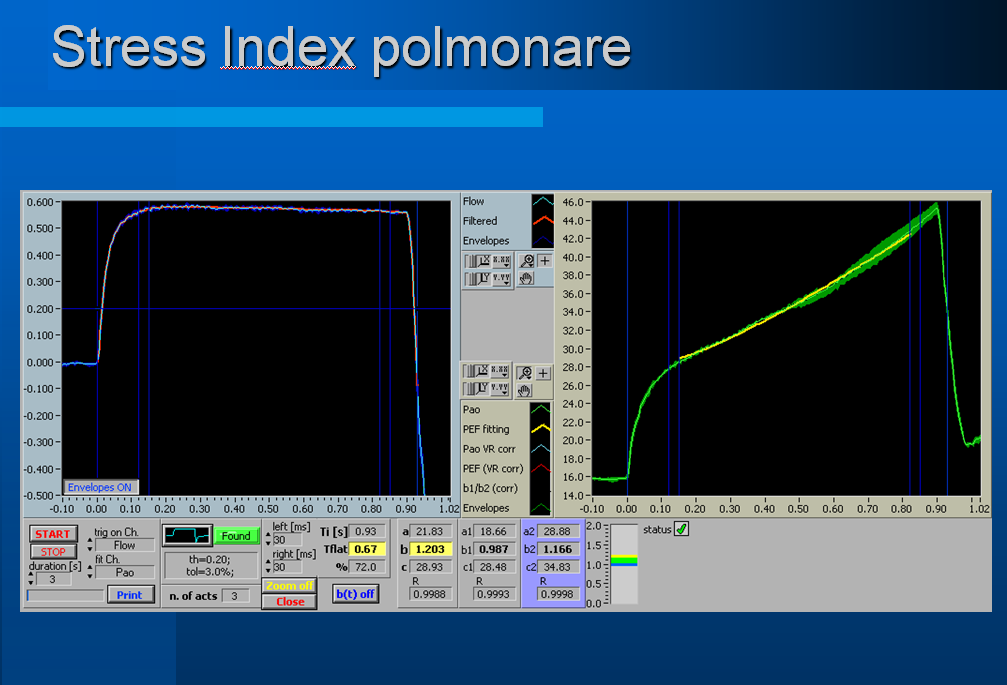
During a constant-flow inspiration, the shape of the pressure-time curve holds valuable information. If it is fitted with Paw = a·tb + c, the coefficient b, the stress index, describes how compliance changes during the breath:
- b ≈ 1: straight curve, constant compliance;
- b < 1: flattening curve, increasing compliance, consistent with progressive recruitment of lung regions;
- b > 1: steepening curve, decreasing compliance, consistent with overdistension.
Why a dedicated research system
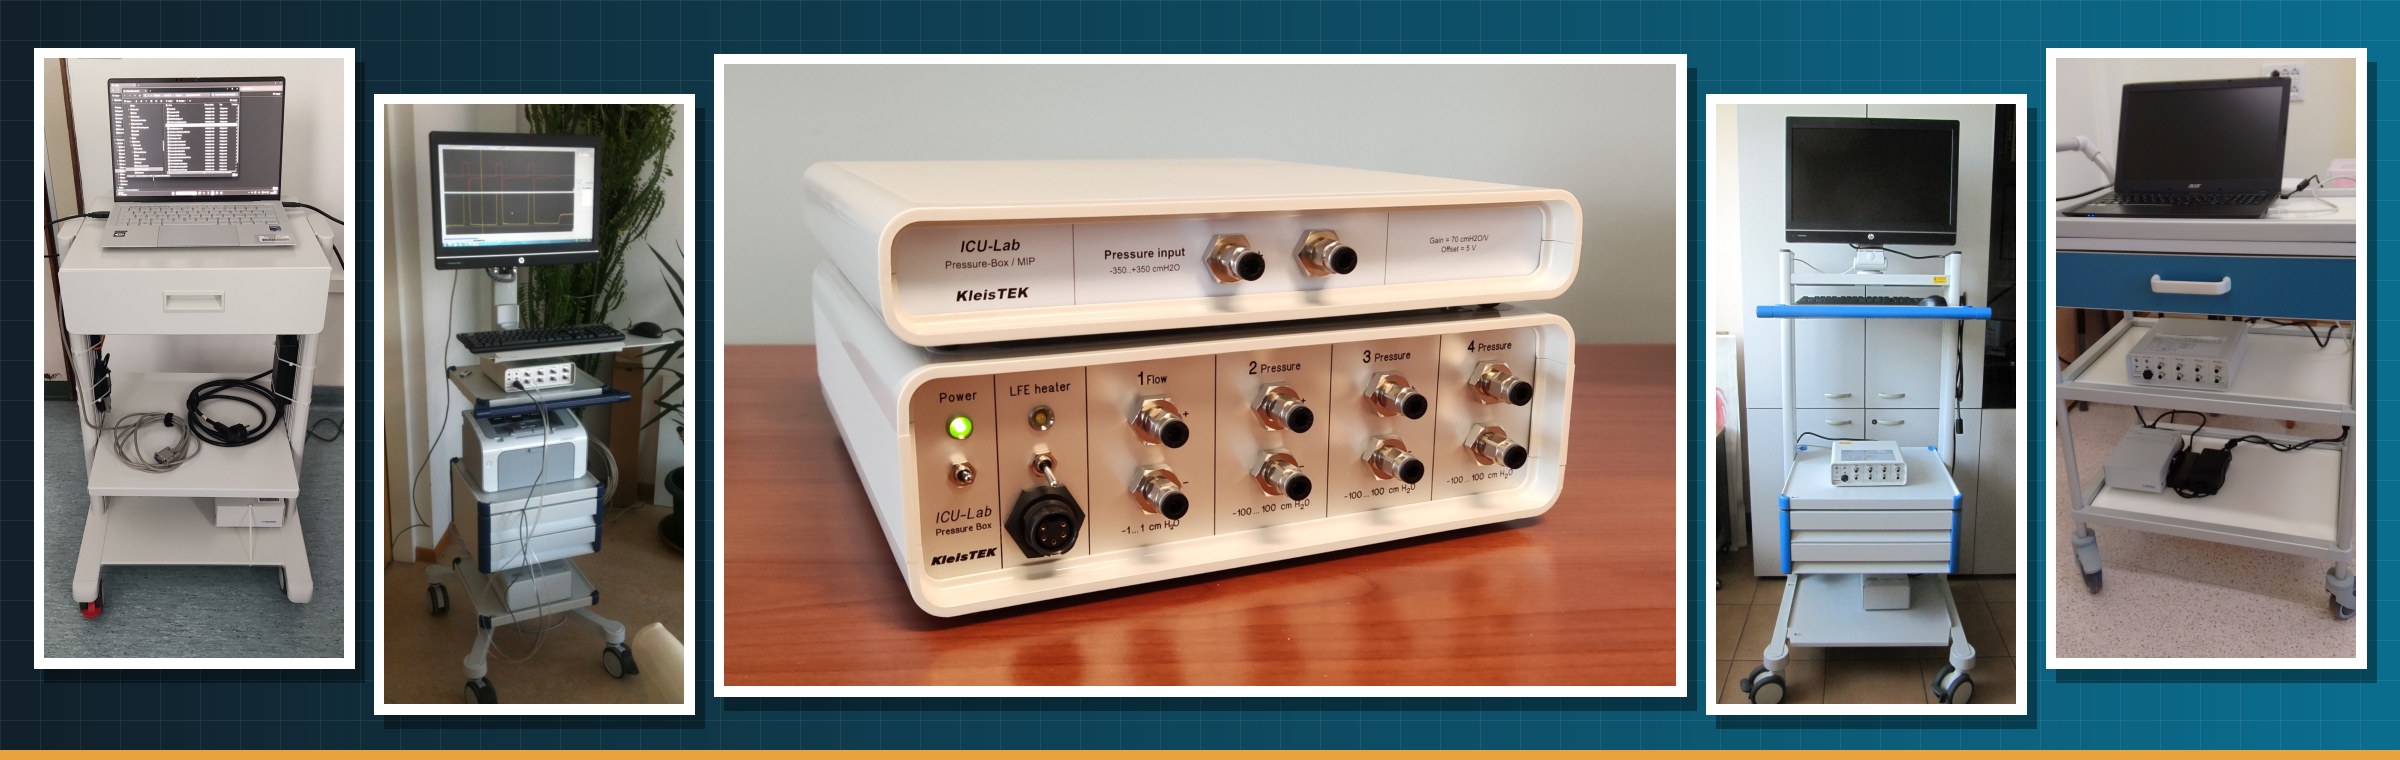
Ventilators display many of these values, but research needs more: recording raw signals at high sampling rates, synchronising them with other channels (oesophageal pressure, haemodynamic signals, diaphragm electrical activity), comparing different ventilation modes and reprocessing data later. ICU-Lab was developed together with clinicians and researchers to meet these needs, and is used today in research centres in Italy and abroad.
Note: ICU-Lab is a research and teaching tool; the values shown are illustrative examples.